


In today’s competitive business environment, having a well-defined sales funnel is paramount. Maximizing it, however, takes a more strategic approach—using the right tool, like a funnel chart. In this article, we will delve deeper into how this method can optimize your sales funnel. Keep reading.
Understanding Sales Funnels and Funnel Charts

In a traditional sense, a sales funnel refers to the customer journey from awareness of your product to the point of purchase. It provides an ideal way to visualize a potential customer’s journey.
The real beauty in understanding this concept though is captured through a funnel chart. This technical tool graphically illustrates the process of converting potential customers into actual ones.
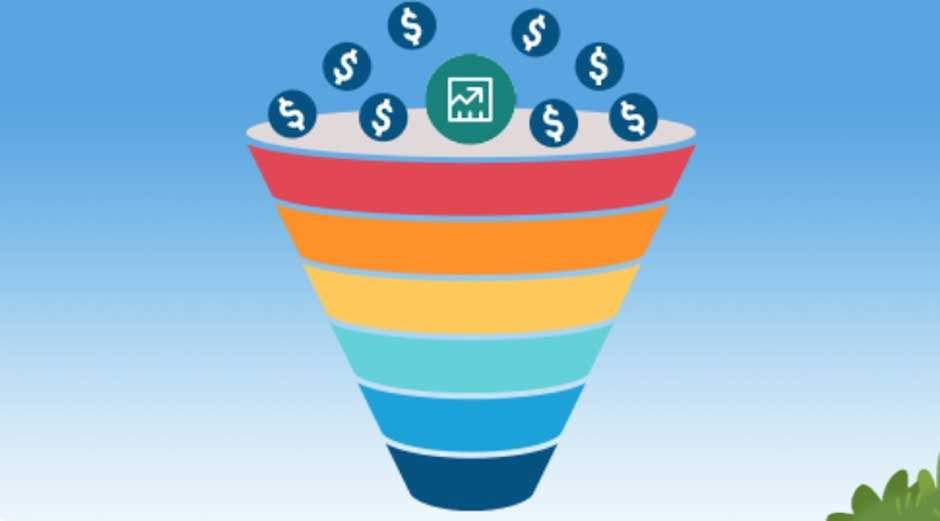
Typically, a funnel chart is wide at the top—representing the initial audience or prospects and tapers as it moves down showing the various stages in the conversion process.
Essentially, this chart provides clear visibility on areas of success or points of drop-off and aids in diagnosing conversion issues in the sales funnel.
Importance of Funnel Charts in Sales Strategy

Funnel charts are pivotal in interpreting data and drawing insights which is vital in formulating successful sales strategies. These visuals enable businesses to identify patterns that might not be obvious otherwise.
The use of a funnel chart is not only limited to sales but it’s also used in various sectors like marketing and customer service to streamline processes and increase efficiency.
In the world of e-commerce, for example, they significantly aid in understanding user behavior and patterns, thus informing strategies to increase conversion rates.
The bottom line is that if you wish to keep a close eye on your customer conversion process, nothing may serve you better than a well-structured funnel chart.
Utilizing Funnel Charts To Identify Weak Points in Sales Funnel
An essential advantage of using a funnel chart is the ability to pinpoint weak spots in the sales process. The chart highlights stages in the funnel where potential customers drop off.
These areas of the sales process can be improved with targeted strategies, enhancing the effectiveness of the sales funnel as a whole.
Once you identify problem areas, you can create targeted solutions, such as improving the engagement levels during the onboarding stage or streamlining the purchase process to be more user-friendly.
The funnel chart thus serves as a roadmap, guiding your sales strategy to be more effective and resilient.
Optimizing Sales Funnel Performance Using Funnel Charts
The main goal of optimizing your sales funnel is to increase conversion rates and subsequently drive sales. Useful tools like funnel charts make this a realistic objective.
The chart helps businesses understand the complete customer journey, from initial contact to purchase, by making the abstract process more concrete.
It may also use the gathered data to show you where you’re wasting resources on ineffective strategies, and where better allocation of resources may significantly increase conversions.
Simply put, a funnel chart provides a realistic view of your customer conversion process, allowing you to streamline and optimize your sales funnel effectively.
Overall, the power of funnel charts in understanding, streamlining, and optimizing sales funnels cannot be overstated. They bring a level of clarity and strategic insight that can significantly improve conversion rates and augment sales. Understanding and embracing this tool could be the critical step in propelling your business to greater heights.